Market Outlook
April 28, 2017
Market Cues
Domestic Indices
Chg (%)
(Pts)
(Close)
Indian markets are likely to open flat tracking the SGX Nifty & global cues.
BSE Sensex
(0.3)
(104)
30,030
U.S. Markets closed higher Thursday ahead of major tech company earnings. The
Nifty
(0.1)
(10)
9,342
Dow Jones industrial average and the S&P 500 struggled to hold opening gains,
Mid Cap
0.1
10
14,772
while the tech-heavy Nasdaq composite closed at a record high.
Small Cap
(0.0)
1(3)
15,279
The majority of the European markets ended Thursday's session in the red, putting
Bankex
0.2
43
25,251
an end to a six session winning streak. Investors were disappointed after the
European Central Bank again made no changes to its monetary policy, while the
U.S. Federal Reserve has been hiking interest rates.
Global Indices
Chg (%)
(Pts)
(Close)
Dow Jones
0.03
176
20,981
Indian markets fell slightly on Thursday amid profit taking in recent outperformers
on the eve of derivatives expiry.
Nasdaq
0.4
24
6,049
FTSE
(52)
(0.7)
7,237
News Analysis
Nikkei
(0.2)
(38)
19,252
Lupin
Hang Seng
0.5
120
24,698
Detailed analysis on Pg2
Shanghai Com
0.4
11
3,152
Investor’s Ready Reckoner
Key Domestic & Global Indicators
Advances / Declines
BSE
NSE
Advances
1,311
1,496
Stock Watch: Latest investment recommendations on 150+ stocks
Refer Pg6 onwards
Declines
1,585
1,203
Unchanged
157
68
Top Picks
CMP
Target
Upside
Company
Sector
Rating
(`)
(`)
(%)
Volumes (` Cr)
Blue Star
Capital Goods
Accumulate
676
760
12.4
BSE
5,022
Dewan Housing Fin. Financials
Accumulate
423
460
8.8
NSE
31,047
Mahindra Lifespace
Real Estate
Buy
437
522
19.5
Navkar Corporation Others
Buy
212
265
24.7
KEI Industries
Capital Goods
Accumulate
212
239
12.7
#Net Inflows (` Cr)
Net
Mtd
Ytd
More Top Picks on Pg4
FII
( 144
-1,189.
43,030
MFs
804
4,895
14,333
Key Upcoming Events
683
6,565
16,003
Previous
Consensus
Date
Region
Event Description
Reading
Expectations
Top Gainers
Price (`)
Chg (%)
Apr 28, 2017 Euro Zone ECB announces interest rates
0.00
0.00
Apr 28, 2017 UK
GDP (YoY)
1.90
2.20
Bankindia
177
8.7
Apr 30, 2017 UK
PMI Manufacturing
54.20
54.00
Network18
49
6.3
May 02, 2017 China
PMI Manufacturing
51.80
51.70
Jswenergy
67
5.2
May 02, 2017 Germany PMI Manufacturing
58.20
--
Mrpl
132
4.9
May 03, 2017 Germany Unemployment change (000's)
-30.00
--
Idfc
61
4.8
More Events on Pg5
Top Losers
Price (`)
Chg (%)
Adanient
114
(4.5)
Balkrisind
1,521
(3.1)
Fortis
210
(2.9)
Jublfood
1,020
(2.9)
Prestige
246
(2.8)
#As on April 27, 2017
Market Outlook
April 28, 2017
News Analysis
Lupin gets 483 for its Goa plant
US health regulator issued Form 483 with three observations to Lupin Goa
plant. The US Food and Drug Administration inspected this plant between
March 27 and April 7, 2017. The observations as per news reports are- failure
to review any unexplained discrepancy; no written procedures for production
and process controls; control procedures that monitor output of manufacturing
processes not established. Goa plant of the company contributed close to 50%
of the US sales (around 25% of consolidated revenue) and accounted for 30
outstanding ANDAs and thus very important for Lupin growth plans. While it’s
difficult to assess the impact on the same as the company still has time to
respond back to the queries and also, since queries are small and can be
responded, as of now we are not changing the estimates and maintain our
buy with a price target of `1,809.
Economic and Political News
Indian real estate sector to witness $7 billion investment in 2017: CBRE
Growth in FMCG demand in rural areas to be in double digit: Adi Godrej
7th Pay Commission: Lavasa panel submits report on allowances to Jaitley
Corporate News
Biocon Q4 net up 75% at `135cr
Motilal Oswal Q4 profit jumps 113% to `90cr
Maruti earmarks `4,500cr capex for FY18
Quarterly Bloomberg Brokers Consensus Estimate
Federal Bank Ltd - Apr 28, 2017
Particulars ( ` cr)
4QFY17E
4QFY16
y-o-y (%)
3QFY17
q-o-q (%)
Net profit
227
10
2,113.9
206
10.5
Ambuja Cements Ltd - Apr 28, 2017
Particulars ( ` cr)
1QCY17E
1QCY16
y-o-y (%)
4QCY16 q-o-q (%)
Net sales
2,513
2,418
3.9
2,197
14.4
EBITDA
418
450
(7.0)
329
27.1
EBITDA margin (%)
16.6
18.6
15.0
Net profit
263
304
(13.5)
176
49.5
UPL Ltd Consol - Apr 28, 2017
Particulars ( ` cr)
4QFY17E
4QFY16
y-o-y (%)
3QFY17
q-o-q (%)
Net sales
4,897
4,292
14.1
3,855
27.1
EBITDA
1,135
981
15.7
750
51.3
EBITDA margin (%)
23.2
22.9
19.5
Net profit
665
560
18.7
459
44.8
Market Outlook
April 28, 2017
Dabur India Ltd Consol - May 1, 2017
Particulars ( ` cr)
4QFY17E
4QFY16
y-o-y (%)
3QFY17
q-o-q (%)
Net sales
2,011
2,157
(6.8)
1,848
8.8
EBITDA
401
415
(3.5)
334
20.0
EBITDA margin (%)
19.9
19.3
18.1
Net profit
338
332
1.8
294
15.0
Top Picks ★★★★★
Market Cap
CMP
Target
Upside
Company
Rationale
(` Cr)
(`)
(`)
(%)
Strong growth in domestic business due to its leadership in
Alkem Laboratories
22,908
1,916
2,257
17.8
acute therapeutic segment. Alkem expects to launch more
products in USA, which bodes for its international business.
We expect the company would report strong profitability
Asian Granito
1,137
378
405
7.1
owing to better product mix, higher B2C sales and
amalgamation synergy..
Among the top 4 players in the consumer durables segment.
Bajaj Electricals
3,514
347
395
13.9
Improved profitability backed by turn around in E&P segment.
Strong order book lends earnings visibility.
Favourable outlook for the AC industry to augur well for
Cooling products business which is out pacing the market
Blue Star
6,460
676
760
12.4
growth. EMPPAC division's profitability to improve once
operating environment turns around..
With a focus on the low and medium income (LMI) consumer
Dewan Housing Finance
13,245
423
460
8.8
segment, the company has increased its presence in tier-II &
III cities where the growth opportunity is immense.
Strong loan growth backed by diversified loan portfolio and
Equitas Holdings
5,711
169
235
39.0
adequate CAR. ROE & ROA likely to remain decent as risk of
dilution remains low. Attractive valuations considering growth.
Economic recovery to have favourable impact on advertising
& circulation revenue growth. Further, the acquisition of a
Jagran Prakashan
6,398
196
225
15.0
radio business (Radio City) would also boost the company's
revenue growth.
High order book execution in EPC segment, rising B2C sales
KEI Industries
1,646
212
239
12.7
and higher exports to boost the revenues and profitability
Speedier execution and speedier sales, strong revenue visibilty
Mahindra Lifespace
1,793
437
522
19.5
in short-to-long run, attractive valuations
Massive capacity expansion along with rail advantage at ICD
Navkar Corporation
3,030
212
265
24.7
as well CFS augurs well for the company
Strong brands and distribution network would boost growth
Siyaram Silk Mills
1,595
1,701
1,872
10.1
going ahead. Stock currently trades at an inexpensive
valuation.
Market leadership in Hindi news genre and no. 2 viewership
ranking in English news genre, exit from the radio business,
TV Today Network
1,607
269
344
27.7
and anticipated growth in ad spends by corporates to benefit
the stock.
Source: Company, Angel Research
Market Outlook
April 28, 2017
Key Upcoming Events
Result Calendar
Date
Company
Apr 28, 2017
CEAT, Ambuja Cements, IDFC, Federal Bank
May 1, 2017
Dabur India
May 2, 2017
Marico
May 3, 2017
ICICI Bank, Alembic Pharma
May 4, 2017
Exide Industries, Bank of Maharashtra, MRF
May 5, 2017
Apollo Tyres, Visaka Industries, Aventis
May 6, 2017
L G Balakrishnan & Bros
Source: Bloomberg, Angel Research
Global economic events release calendar
Date
Time
Country
Event Description
Unit
Period
Bloomberg Data
Last Reported Estimated
Apr 28, 2017
5:15PM Euro Zone
ECB announces interest rates
%
Apr 27
--
--
2:00PM UK
GDP (YoY)
% Change
1Q A
1.90
2.20
Apr 30, 2017
2:00PM UK
PMI Manufacturing
Value
Apr
54.20
54.00
May 2,, 2017 6:30AM China
PMI Manufacturing
Value
Apr
51.80
51.70
1:25PM Germany
PMI Manufacturing
Value
Apr F
58.20
--
May 3,, 2017 1:25PM Germany
Unemployment change (000's)
Thousands
Apr
(30.00)
--
11:30PM US
FOMC rate decision
%
May 3
1.00
1.00
2:30PM Euro Zone
Euro-Zone GDP s.a. (QoQ)
% Change
1Q A
0.50
--
May 4,, 2017 1:25PM Germany
PMI Services
Value
Apr F
54.70
--
May 5,, 2017 6:00PM US
Change in Nonfarm payrolls
Thousands
Apr
98.00
193.00
6:00PM US
Unnemployment rate
%
Apr
4.50
4.60
May 8,, 2017
China
Exports YoY%
% Change
Apr
16.40
--
May 10, 2017 7:00AM China
Consumer Price Index (YoY)
% Change
Apr
0.90
--
India
Imports YoY%
% Change
Apr
45.30
--
US
Producer Price Index (mom)
% Change
Apr
(0.20)
--
May 11, 2017
India
Exports YoY%
% Change
Apr
27.60
--
2:00PM UK
Industrial Production (YoY)
% Change
Mar
2.80
--
4:30PM UK
BOE Announces rates
% Ratio
May 11
0.25
--
May 12, 2017 5:30PM India
Industrial Production YoY
% Change
Mar
(1.20)
--
6:00PM US
Consumer price index (mom)
% Change
Apr
(0.30)
0.20
11:30AM Germany
GDP nsa (YoY)
% Change
1Q P
1.20
--
May 15, 201712:00PM India
Monthly Wholesale Prices YoY%
% Change
Apr
5.70
--
7:30AM China
Industrial Production (YoY)
% Change
Apr
7.60
--
May 16, 2017 6:00PM US
Housing Starts
Thousands
Apr
1,215.00
--
6:45PM US
Industrial Production
%
Apr
0.55
--
2:00PM UK
CPI (YoY)
% Change
Apr
2.30
--
2:30PM Euro Zone
Euro-Zone CPI (YoY)
%
Apr F
1.50
--
Source: Bloomberg, Angel Research
Market Outlook
April 28, 2017
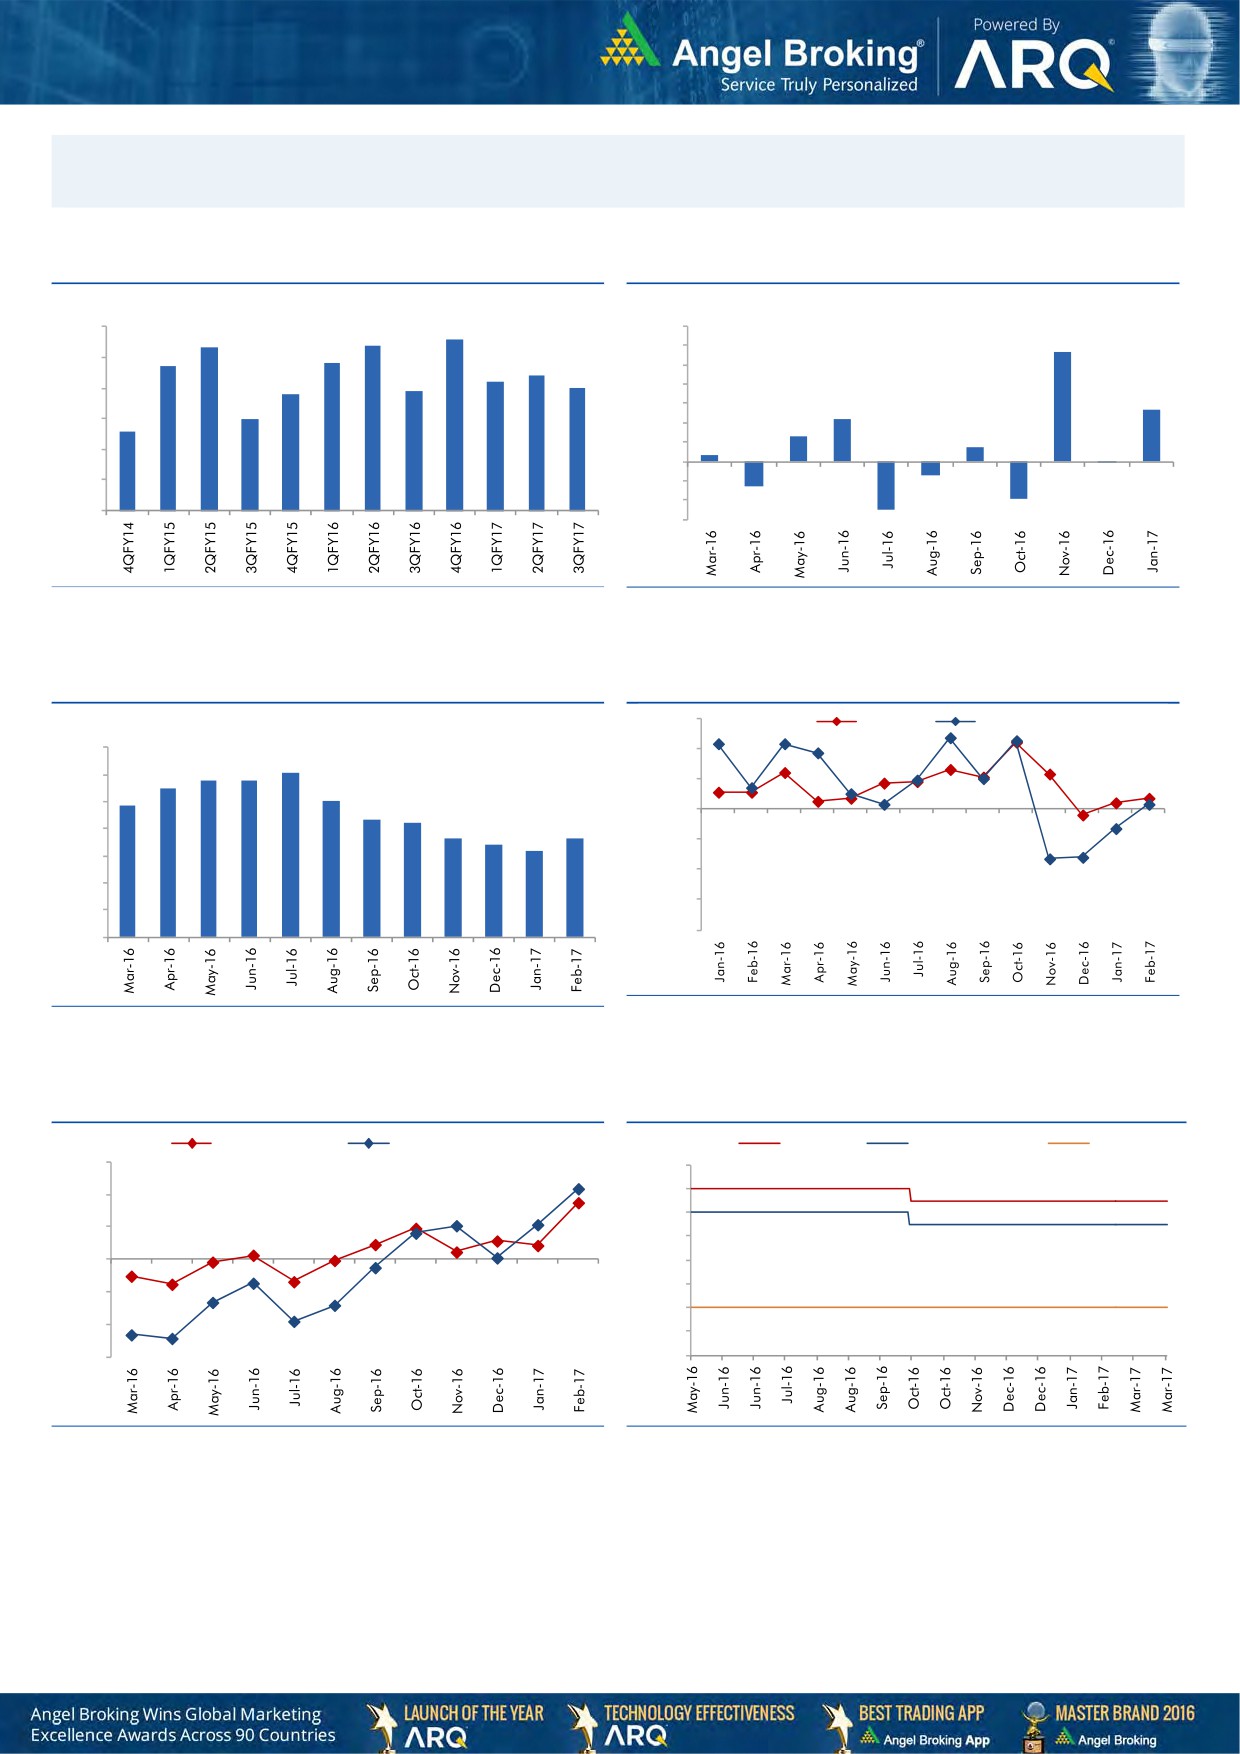
Macro watch
Exhibit 1: Quarterly GDP trends
Exhibit 2: IIP trends
(%)
(%)
8.6
9.0
8.4
7.0
8.3
5.7
7.7
7.8
6.0
8.0
7.4
7.2
5.0
6.9
7.0
6.8
7.0
4.0
2.7
6.0
3.0
2.2
6.0
5.6
1.3
2.0
0.7
1.0
0.3
5.0
-
4.0
(1.0)
(0.1)
(0.7)
(2.0)
3.0
(1.3)
(3.0)
(1.9)
(2.5)
Source: CSO, Angel Research
Source: MOSPI, Angel Research
Exhibit 3: Monthly CPI inflation trends
Exhibit 4: Manufacturing and services PMI
56.0
Mfg. PMI
Services PMI
(%)
7.0
54.0
6.1
5.8
5.8
6.0
5.5
5.1
52.0
4.8
5.0
4.3
4.2
50.0
3.6
3.7
4.0
3.4
3.2
48.0
3.0
46.0
2.0
44.0
1.0
42.0
-
Source: Market, Angel Research; Note: Level above 50 indicates expansion
Source: MOSPI, Angel Research
Exhibit 5: Exports and imports growth trends
Exhibit 6: Key policy rates
(%)
Exports yoy growth
Imports yoy growth
(%)
Repo rate
Reverse Repo rate
CRR
30.0
7.00
20.0
6.50
6.00
10.0
5.50
0.0
5.00
4.50
(10.0)
4.00
(20.0)
3.50
(30.0)
3.00
Source: Bloomberg, Angel Research
Source: RBI, Angel Research
Market Outlook
April 28, 2017
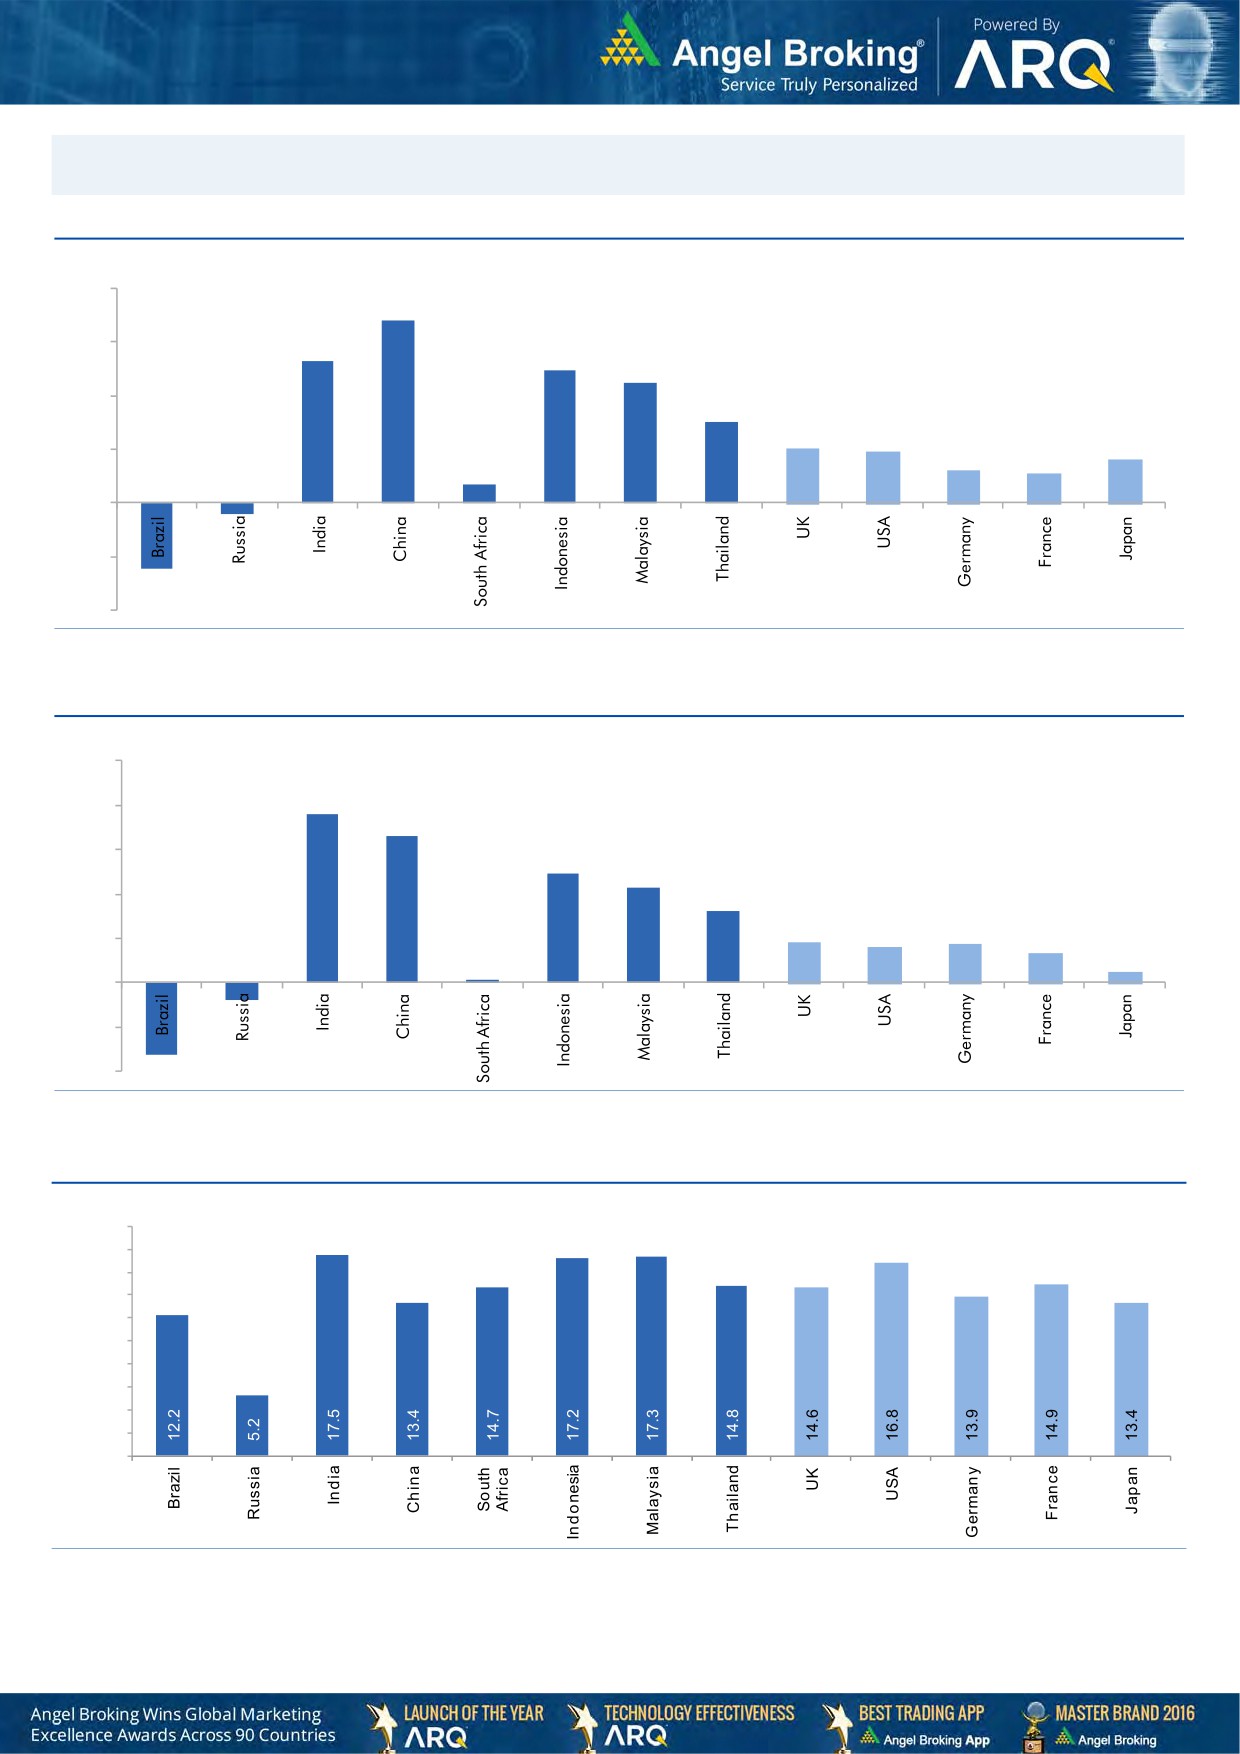
Global watch
Exhibit 1: Latest quarterly GDP Growth (%, yoy) across select developing and developed countries
(%)
8.0
6.8
6.0
5.3
4.9
0.7
4.5
4.0
3.0
2.0
1.9
2.0
1.2
1.6
1.1
-
(2.0)
(0.4)
(2.5)
(4.0)
Source: Bloomberg, Angel Research
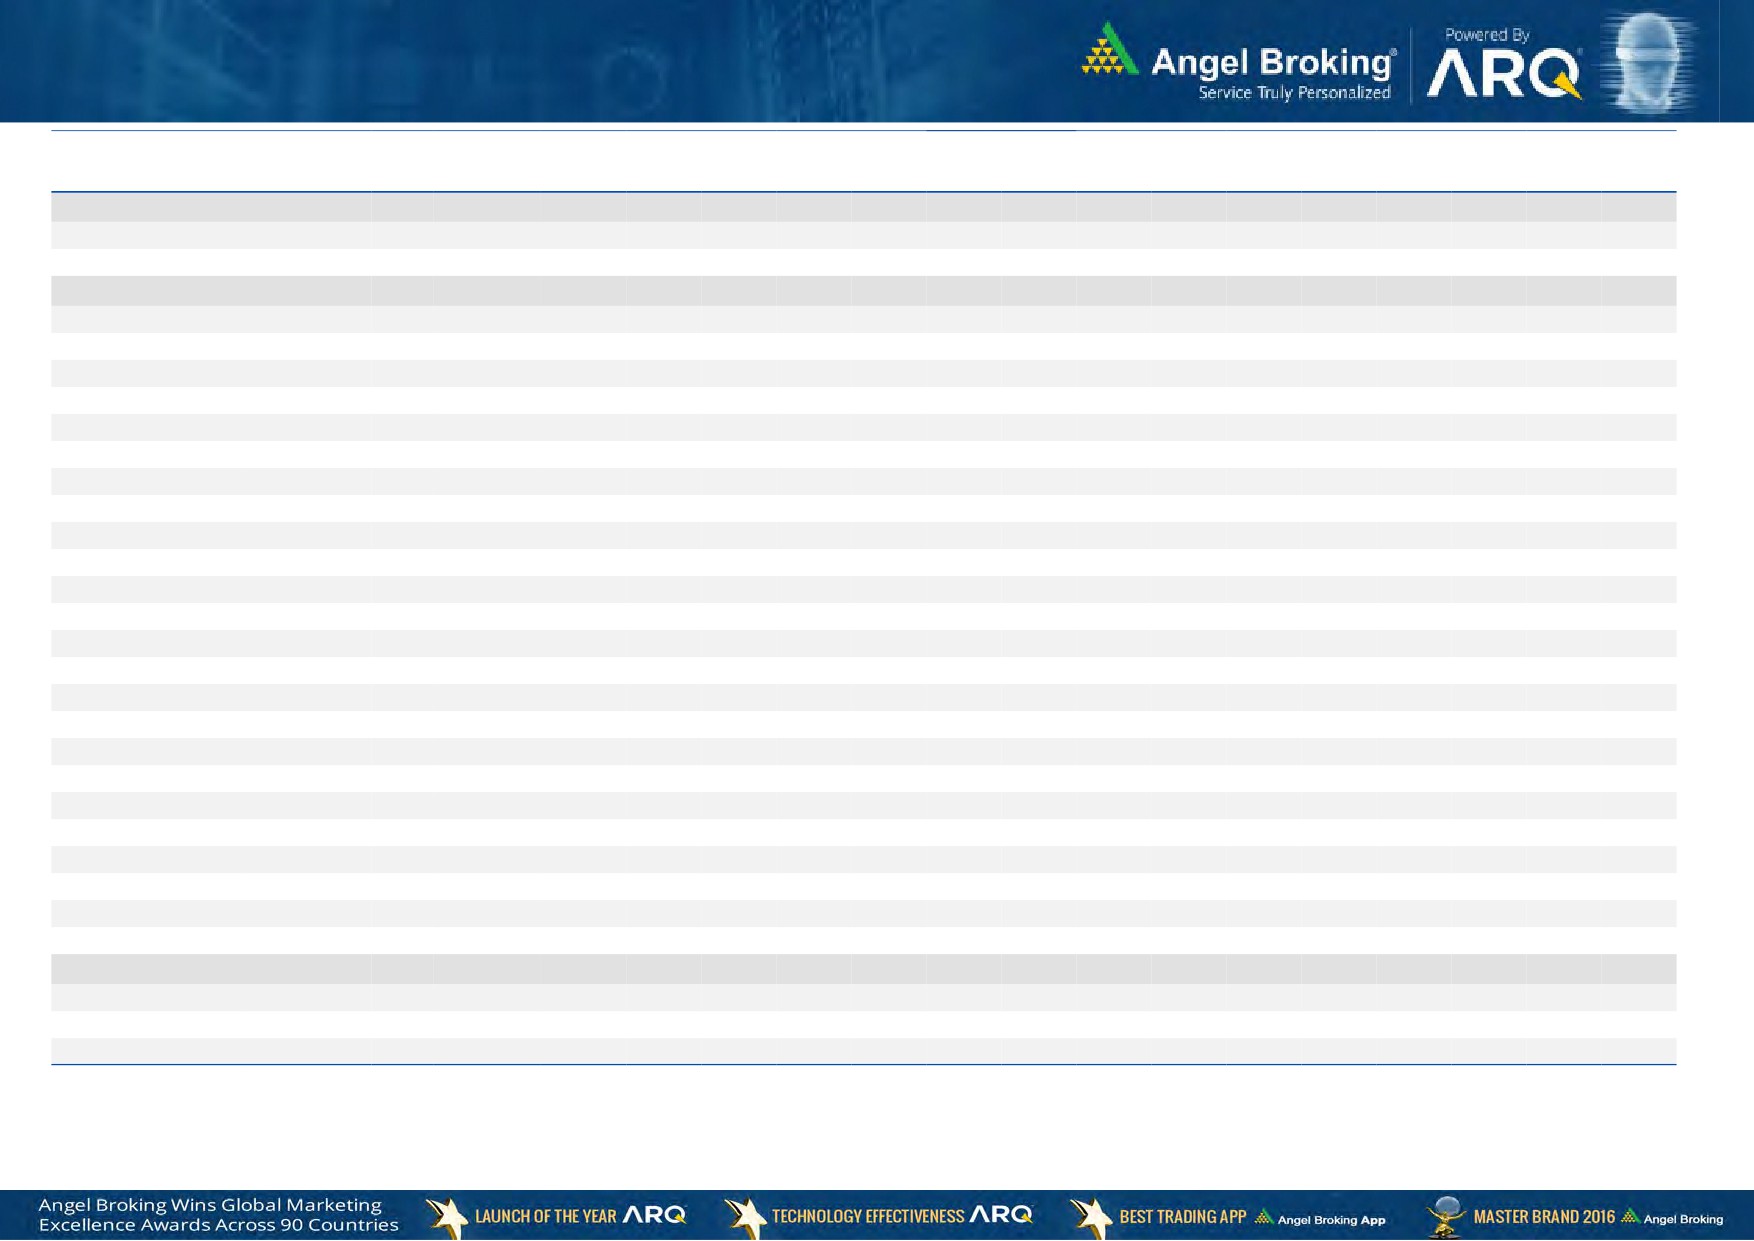
Exhibit 2: 2016 GDP Growth projection by IMF (%, yoy) across select developing and developed countries
(%)
10.0
7.6
8.0
6.6
6.0
4.9
4.3
4.0
3.2
1.8
1.7
1.6
2.0
1.3
(0.8)
0.5
(3.3)
0.1
-
(2.0)
(4.0)
Source: IMF, Angel Research
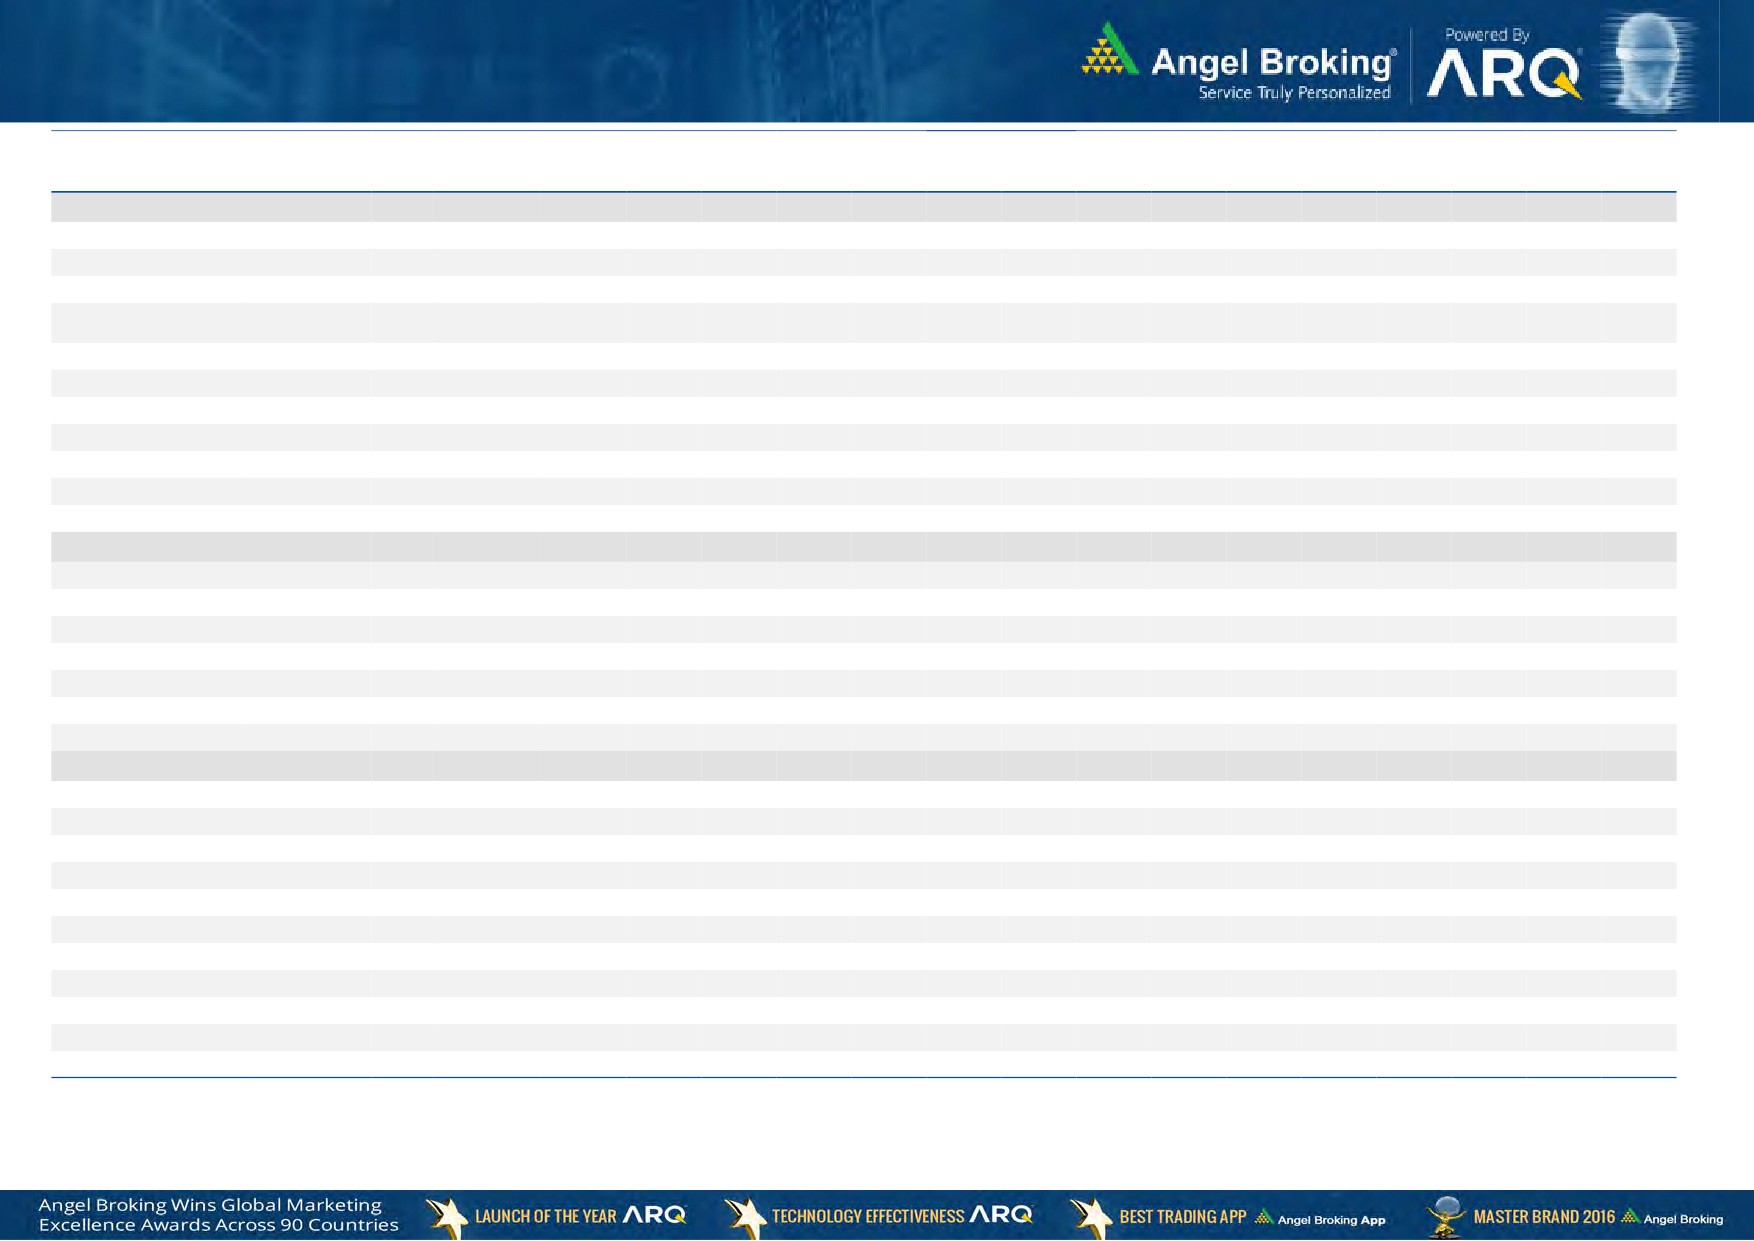
Exhibit 3: One year forward P-E ratio across select developing and developed countries
(x)
20.0
18.0
16.0
14.0
12.0
10.0
8.0
6.0
4.0
2.0
-
Source: IMF, Angel Research
Stock Watch
April 28, 2017
Company Name
Reco
CMP
Target
Mkt Cap
Sales ( Čcr )
OPM(%)
EPS (Č)
PER(x)
P/BV(x)
RoE(%)
EV/Sales(x)
(Č)
Price ( Č)
( Č cr )
FY17E
FY18E
FY17E
FY18E
FY17E
FY18E
FY17E
FY18E
FY17E
FY18E
FY17E
FY18E
FY17E
FY18E
Agri / Agri Chemical
Rallis
Neutral
240
-
4,674
1,937
2,164
13.3
14.3
9.0
11.0
26.7
21.9
4.7
4.1
18.4
19.8
2.5
2.2
United Phosphorus
Neutral
820
-
41,654
15,176
17,604
18.5
18.5
37.4
44.6
21.9
18.4
4.3
3.6
21.4
21.2
2.9
2.4
Auto & Auto Ancillary
Amara Raja Batteries
Accumulate
882
1,009
15,067
5,305
6,100
16.0
16.3
28.4
34.0
31.1
25.9
6.0
5.0
19.3
19.3
2.8
2.5
Apollo Tyres
Neutral
248
-
12,616
12,877
14,504
14.3
13.9
21.4
23.0
11.6
10.8
1.8
1.6
16.4
15.2
1.1
1.1
Ashok Leyland
Buy
87
111
24,674
20,021
21,915
11.6
11.9
4.5
5.3
19.3
16.3
3.9
3.5
20.6
21.5
1.2
1.1
Bajaj Auto
Neutral
2,861
-
82,776
25,093
27,891
19.5
19.2
143.9
162.5
19.9
17.6
5.6
4.8
30.3
29.4
3.0
2.6
Bharat Forge
Neutral
1,134
-
26,397
7,726
8,713
20.5
21.2
35.3
42.7
32.1
26.6
5.9
5.4
18.9
20.1
3.5
3.0
Ceat
Neutral
1,544
-
6,244
7,524
8,624
13.0
12.7
131.1
144.3
11.8
10.7
2.2
1.8
19.8
18.6
0.9
0.8
Eicher Motors
Neutral
25,967
-
70,657
16,583
20,447
17.5
18.0
598.0
745.2
43.4
34.9
14.8
11.3
41.2
38.3
4.1
3.3
Exide Industries
Neutral
228
-
19,342
7,439
8,307
15.0
15.0
8.1
9.3
28.1
24.5
3.9
3.5
14.3
16.7
2.2
2.0
Gabriel India
Neutral
126
-
1,808
1,544
1,715
9.0
9.3
5.4
6.3
23.3
20.0
4.4
3.9
18.9
19.5
1.1
1.0
Hero Motocorp
Neutral
3,297
-
65,843
28,083
30,096
15.3
15.7
171.8
187.0
19.2
17.6
6.7
5.6
30.1
27.9
2.2
2.0
Indag Rubber
Neutral
205
-
538
286
326
19.8
16.8
11.7
13.3
17.5
15.4
3.0
2.8
17.8
17.1
1.5
1.4
Jamna Auto Industries
Neutral
241
-
1,917
1,486
1,620
9.8
9.9
15.0
17.2
16.0
14.0
3.5
3.0
21.8
21.3
1.4
1.2
JK Tyres
Neutral
161
-
3,643
7,455
8,056
15.0
15.0
21.8
24.5
7.4
6.6
1.5
1.3
22.8
21.3
0.6
0.5
L G Balakrishnan & Bros Neutral
624
-
979
1,302
1,432
11.6
11.9
43.7
53.0
14.3
11.8
2.0
1.8
13.8
14.2
0.8
0.8
Mahindra and Mahindra Neutral
1,338
-
83,102
46,534
53,077
11.6
11.7
67.3
78.1
19.9
17.1
3.2
2.8
15.4
15.8
1.8
1.5
Maruti
Neutral
6,371
-
192,460
67,822
83,288
16.0
16.4
253.8
312.4
25.1
20.4
5.8
4.7
23.0
22.9
2.5
2.0
Minda Industries
Neutral
477
-
3,784
2,728
3,042
9.0
9.1
68.2
86.2
7.0
5.5
1.6
1.3
23.8
24.3
1.4
1.3
Motherson Sumi
Neutral
388
-
54,445
45,896
53,687
7.8
8.3
13.0
16.1
29.8
24.1
9.6
7.7
34.7
35.4
1.3
1.1
Rane Brake Lining
Neutral
1,004
-
795
511
562
11.3
11.5
28.1
30.9
35.7
32.5
5.5
5.0
15.3
15.0
1.7
1.6
Setco Automotive
Neutral
41
-
549
741
837
13.0
13.0
15.2
17.0
2.7
2.4
0.4
0.4
15.8
16.3
1.1
1.0
Subros
Neutral
232
-
1,391
1,488
1,681
11.7
11.9
6.4
7.2
36.2
32.4
3.8
3.5
10.8
11.4
1.2
1.0
Swaraj Engines
Neutral
1,815
-
2,254
660
810
15.2
16.4
54.5
72.8
33.3
24.9
10.4
9.4
31.5
39.2
3.2
2.6
Tata Motors
Neutral
456
-
131,649
300,209
338,549
8.9
8.4
42.7
54.3
10.7
8.4
1.7
1.4
15.6
17.2
0.6
0.5
TVS Motor
Neutral
503
-
23,899
13,390
15,948
6.9
7.1
12.8
16.5
39.4
30.4
9.8
7.8
26.3
27.2
1.8
1.5
Capital Goods
ACE
Neutral
63
-
622
709
814
4.1
4.6
1.4
2.1
44.9
29.9
1.9
1.8
4.4
6.0
1.0
0.9
BEML
Neutral
1,407
-
5,861
3,451
4,055
6.3
9.2
31.4
57.9
44.8
24.3
2.7
2.4
6.3
10.9
1.8
1.5
BGR Energy
Neutral
165
-
1,191
16,567
33,848
6.0
5.6
7.8
5.9
21.2
28.0
1.2
1.2
4.7
4.2
0.2
0.1
Stock Watch
April 28, 2017
Company Name
Reco
CMP
Target
Mkt Cap
Sales ( Čcr )
OPM(%)
EPS (Č)
PER(x)
P/BV(x)
RoE(%)
EV/Sales(x)
(Č)
Price ( Č)
( Č cr )
FY17E
FY18E
FY17E
FY18E
FY17E
FY18E
FY17E
FY18E
FY17E
FY18E
FY17E
FY18E
FY17E
FY18E
Capital Goods
Bharat Electronics
Neutral
180
-
40,105
8,137
9,169
16.8
17.2
58.7
62.5
3.1
2.9
0.5
0.4
44.6
46.3
3.9
3.5
BHEL
Neutral
176
-
43,102
28,797
34,742
-
2.8
2.3
6.9
76.6
25.5
1.3
1.3
1.3
4.8
1.2
0.8
Blue Star
Accumulate
676
760
6,460
4,283
5,077
5.9
7.3
14.9
22.1
45.4
30.5
8.8
7.4
20.4
26.4
1.6
1.3
CG Power and Industrial
Neutral
78
-
4,907
5,777
6,120
5.9
7.0
3.3
4.5
23.7
17.4
1.0
1.0
4.4
5.9
0.8
0.7
Solutions
Greaves Cotton
Neutral
171
-
4,175
1,755
1,881
16.8
16.9
7.8
8.5
21.9
20.1
4.4
4.1
20.6
20.9
2.1
1.9
Inox Wind
Neutral
197
-
4,372
5,605
6,267
15.7
16.4
24.8
30.0
7.9
6.6
2.2
1.6
25.9
24.4
0.8
0.7
KEC International
Neutral
218
-
5,601
9,294
10,186
7.9
8.1
9.9
11.9
22.0
18.3
3.2
2.8
15.6
16.3
0.8
0.8
KEI Industries
Accumulate
212
239
1,646
2,682
3,058
10.4
10.0
11.7
12.8
18.0
16.5
3.6
3.0
20.1
18.2
0.8
0.7
Thermax
Neutral
1,030
-
12,270
5,421
5,940
7.3
7.3
25.7
30.2
40.1
34.1
4.8
4.4
12.2
13.1
2.1
2.0
VATech Wabag
Neutral
680
-
3,712
3,136
3,845
8.9
9.1
26.0
35.9
26.2
18.9
3.3
2.8
13.4
15.9
1.1
0.9
Voltas
Neutral
410
-
13,550
6,511
7,514
7.9
8.7
12.9
16.3
31.7
25.1
5.7
5.0
16.7
18.5
1.8
1.6
Cement
ACC
Neutral
1,633
-
30,670
11,225
13,172
13.2
16.9
44.5
75.5
36.7
21.6
3.5
3.2
11.2
14.2
2.7
2.3
Ambuja Cements
Neutral
249
-
49,532
9,350
10,979
18.2
22.5
5.8
9.5
43.0
26.3
3.6
3.2
10.2
12.5
5.3
4.5
India Cements
Neutral
212
-
6,508
4,364
4,997
18.5
19.2
7.9
11.3
26.8
18.8
1.9
1.9
8.0
8.5
2.3
2.0
J K Lakshmi Cement
Neutral
466
-
5,486
2,913
3,412
14.5
19.5
7.5
22.5
62.2
20.7
3.8
3.2
12.5
18.0
2.5
2.1
JK Cement
Neutral
960
-
6,714
4,398
5,173
15.5
17.5
31.2
55.5
30.8
17.3
3.7
3.2
12.0
15.5
2.1
1.7
Orient Cement
Neutral
161
-
3,289
2,114
2,558
18.5
20.5
8.1
11.3
19.8
14.2
2.9
2.5
9.0
14.0
2.2
1.7
UltraTech Cement
Neutral
4,233
-
116,210
25,768
30,385
21.0
23.5
111.0
160.0
38.1
26.5
4.9
4.3
13.5
15.8
4.6
3.8
Construction
Engineers India
Neutral
167
-
11,257
1,725
1,935
16.0
19.1
11.4
13.9
14.7
12.0
2.0
2.0
13.4
15.3
5.5
4.9
Gujarat Pipavav Port
Neutral
157
-
7,590
705
788
52.2
51.7
5.0
5.6
31.4
28.0
3.1
2.8
11.2
11.2
10.4
8.8
ITNL
Neutral
114
-
3,760
8,946
10,017
31.0
31.6
8.1
9.1
14.1
12.6
0.5
0.5
4.2
5.0
3.8
3.5
KNR Constructions
Neutral
197
-
2,772
1,385
1,673
14.7
14.0
41.2
48.5
4.8
4.1
0.9
0.8
14.9
15.2
2.1
1.7
Larsen & Toubro
Neutral
1,763
-
164,536
111,017
124,908
11.0
11.0
61.1
66.7
28.9
26.4
3.5
3.2
13.1
12.9
2.5
2.3
MEP Infra
Neutral
61
-
991
1,877
1,943
30.6
29.8
3.0
4.2
20.3
14.5
9.8
6.6
0.6
0.6
1.9
1.7
Nagarjuna Const.
Neutral
95
-
5,273
8,842
9,775
9.1
8.8
5.3
6.4
17.9
14.8
1.4
1.3
8.2
9.1
0.8
0.7
NBCC
Neutral
200
-
17,982
7,428
9,549
7.9
8.6
8.2
11.0
24.4
18.2
1.2
1.0
28.2
28.7
2.1
1.6
PNC Infratech
Neutral
156
-
3,992
2,350
2,904
13.1
13.2
9.0
8.8
17.3
17.7
0.6
0.6
15.9
13.9
1.8
1.5
Power Mech Projects
Neutral
555
-
816
1,801
2,219
12.7
14.6
72.1
113.9
7.7
4.9
1.4
1.2
16.8
11.9
0.5
0.3
Sadbhav Engineering
Neutral
329
-
5,640
3,598
4,140
10.3
10.6
9.0
11.9
36.5
27.6
3.8
3.4
9.9
11.9
1.9
1.6
Stock Watch
April 28, 2017
Company Name
Reco
CMP
Target
Mkt Cap
Sales ( Čcr )
OPM(%)
EPS (Č)
PER(x)
P/BV(x)
RoE(%)
EV/Sales(x)
(Č)
Price ( Č)
( Č cr )
FY17E
FY18E
FY17E
FY18E
FY17E
FY18E
FY17E
FY18E
FY17E
FY18E
FY17E
FY18E
FY17E
FY18E
Construction
Simplex Infra
Neutral
405
-
2,003
6,829
7,954
10.5
10.5
31.4
37.4
12.9
10.8
1.3
1.2
9.9
13.4
0.7
0.6
SIPL
Neutral
102
-
3,609
1,036
1,252
65.5
66.2
(8.4)
(5.6)
3.8
4.4
(22.8)
(15.9)
11.7
9.7
Financials
Axis Bank
Accumulate
506
580
121,201
46,932
53,575
3.5
3.4
32.4
44.6
15.6
11.3
2.0
1.8
13.6
16.5
-
-
Bank of Baroda
Neutral
181
-
41,786
19,980
23,178
1.8
1.8
11.5
17.3
15.8
10.5
1.8
1.5
8.3
10.1
-
-
Can Fin Homes
Neutral
2,597
-
6,914
420
526
3.5
3.5
86.5
107.8
30.0
24.1
6.5
5.3
23.6
24.1
-
-
Canara Bank
Neutral
329
-
19,660
15,225
16,836
1.8
1.8
14.5
28.0
22.7
11.8
1.6
1.3
5.8
8.5
-
-
Cholamandalam Inv. &
Accumulate
1,105
1,230
17,275
2,012
2,317
6.3
6.3
42.7
53.6
25.9
20.6
4.1
3.5
16.9
18.3
-
-
Fin. Co.
Dewan Housing Finance Accumulate
423
460
13,245
2,225
2,688
2.9
2.9
29.7
34.6
14.2
12.2
2.3
1.5
16.1
14.8
-
-
Equitas Holdings
Buy
169
235
5,711
939
1,281
11.7
11.5
5.8
8.2
29.2
20.6
2.5
2.2
10.9
11.5
-
-
Federal Bank
Buy
95
115
16,300
8,259
8,995
3.0
3.0
4.3
5.6
22.0
16.9
1.9
1.7
8.5
10.1
-
-
HDFC
Neutral
1,567
-
249,000
11,475
13,450
3.4
3.4
45.3
52.5
34.6
29.9
6.7
5.9
20.2
20.5
-
-
HDFC Bank
Accumulate
1,567
1,650
401,615
46,097
55,433
4.5
4.5
58.4
68.0
26.8
23.1
4.7
3.9
18.8
18.6
-
-
ICICI Bank
Accumulate
274
315
159,643
42,800
44,686
3.1
3.3
18.0
21.9
15.2
12.5
2.1
1.9
11.1
12.3
-
-
Karur Vysya Bank
Buy
117
140
7,070
5,640
6,030
3.3
3.2
8.9
10.0
13.2
11.7
1.4
1.3
11.2
11.4
-
-
Lakshmi Vilas Bank
Neutral
180
-
3,452
3,339
3,799
2.7
2.8
11.0
14.0
16.4
12.9
1.7
1.6
11.2
12.7
-
-
LIC Housing Finance
Neutral
670
-
33,825
3,712
4,293
2.6
2.5
39.0
46.0
17.2
14.6
3.2
2.8
19.9
20.1
-
-
Punjab Natl.Bank
Neutral
165
-
35,048
23,532
23,595
2.3
2.4
6.8
12.6
24.2
13.1
3.7
2.7
3.3
6.5
-
-
RBL Bank
Neutral
553
-
20,465
1,783
2,309
2.6
2.6
12.7
16.4
43.6
33.7
4.8
4.2
12.8
13.3
-
-
Repco Home Finance
Accumulate
752
825
4,704
388
457
4.5
4.2
30.0
38.0
25.1
19.8
4.2
3.5
18.0
19.2
-
-
South Ind.Bank
Neutral
25
-
4,435
6,435
7,578
2.5
2.5
2.7
3.1
9.1
7.9
1.2
1.0
10.1
11.2
-
-
St Bk of India
Neutral
282
-
228,657
88,650
98,335
2.6
2.6
13.5
18.8
20.9
15.0
2.0
1.7
7.0
8.5
-
-
Union Bank
Neutral
160
-
10,989
13,450
14,925
2.3
2.3
25.5
34.5
6.3
4.6
0.9
0.8
7.5
10.2
-
-
Yes Bank
Neutral
1,640
-
74,903
8,978
11,281
3.3
3.4
74.0
90.0
22.2
18.2
4.2
3.6
17.0
17.2
-
-
FMCG
Akzo Nobel India
Neutral
1,966
-
9,427
2,955
3,309
13.3
13.7
57.2
69.3
34.4
28.4
11.2
9.4
32.7
33.3
3.0
2.6
Asian Paints
Neutral
1,103
-
105,766
17,128
18,978
16.8
16.4
19.1
20.7
57.7
53.3
20.1
19.0
34.8
35.5
6.1
5.5
Britannia
Neutral
3,563
-
42,755
9,594
11,011
14.6
14.9
80.3
94.0
44.4
37.9
18.2
14.1
41.2
-
4.3
3.7
Colgate
Neutral
1,036
-
28,164
4,605
5,149
23.4
23.4
23.8
26.9
43.5
38.5
24.1
18.8
64.8
66.8
6.0
5.4
Dabur India
Accumulate
289
304
50,829
8,315
9,405
19.8
20.7
8.1
9.2
35.6
31.4
9.9
8.2
31.6
31.0
5.8
5.1
GlaxoSmith Con*
Neutral
5,184
-
21,802
4,350
4,823
21.2
21.4
179.2
196.5
28.9
26.4
7.7
6.5
27.1
26.8
4.4
3.9
Stock Watch
April 28, 2017
Company Name
Reco
CMP
Target
Mkt Cap
Sales ( Čcr )
OPM(%)
EPS (Č)
PER(x)
P/BV(x)
RoE(%)
EV/Sales(x)
(Č)
Price ( Č)
( Č cr )
FY17E FY18E
FY17E
FY18E
FY17E
FY18E
FY17E
FY18E
FY17E
FY18E
FY17E
FY18E
FY17E
FY18E
FMCG
Godrej Consumer
Neutral
1,743
-
59,368
10,235
11,428
18.4
18.6
41.1
44.2
42.4
39.4
9.4
7.9
24.9
24.8
5.9
5.2
HUL
Neutral
946
-
204,823
35,252
38,495
17.8
17.8
20.7
22.4
45.8
42.3
43.8
37.6
95.6
88.9
5.7
5.2
ITC
Neutral
285
-
346,322
40,059
44,439
38.3
39.2
9.0
10.1
31.8
28.1
8.9
7.7
27.8
27.5
8.1
7.3
Marico
Neutral
318
-
40,979
6,430
7,349
18.8
19.5
6.4
7.7
49.6
41.2
15.0
12.6
33.2
32.5
6.2
5.4
Nestle*
Neutral
6,700
-
64,596
10,073
11,807
20.7
21.5
124.8
154.2
53.7
43.5
22.0
19.8
34.8
36.7
6.2
5.3
Procter & Gamble
Neutral
7,341
-
23,830
2,939
3,342
23.2
23.0
146.2
163.7
50.2
44.9
12.7
10.6
25.3
23.5
7.7
6.7
Hygiene
Tata Global
Neutral
152
-
9,599
8,675
9,088
9.8
9.8
7.4
8.2
20.6
18.6
1.6
1.5
7.9
8.1
1.0
1.0
IT
HCL Tech^
Buy
813
1,000
115,933
49,242
57,168
20.5
20.5
55.7
64.1
14.6
12.7
3.0
2.3
20.3
17.9
2.2
1.8
Infosys
Buy
924
1,179
212,226
68,484
73,963
26.0
26.0
63.0
64.0
14.7
14.4
3.1
2.8
20.8
19.7
2.8
2.4
TCS
Buy
2,301
2,651
453,474
117,966
127,403
27.5
27.6
134.3
144.5
17.1
15.9
5.1
4.7
29.8
29.7
3.5
3.3
Tech Mahindra
Buy
425
600
41,380
29,673
32,937
15.5
17.0
32.8
39.9
13.0
10.7
2.5
2.2
19.6
20.7
1.1
1.0
Wipro
Accumulate
496
570
120,561
55,421
58,536
20.3
20.3
35.1
36.5
14.1
13.6
2.4
2.1
19.2
14.6
1.6
1.4
Media
D B Corp
Neutral
378
-
6,956
2,297
2,590
27.4
28.2
21.0
23.4
18.0
16.2
4.2
3.6
23.7
23.1
2.8
2.4
Hindustan Media
Neutral
290
-
2,128
1,016
1,138
24.3
25.2
27.3
30.1
10.6
9.6
2.0
1.8
16.2
15.8
1.4
1.2
Ventures
HT Media
Neutral
82
-
1,910
2,693
2,991
12.6
12.9
7.9
9.0
10.4
9.1
0.9
0.8
7.8
8.3
0.3
0.2
Jagran Prakashan
Accumulate
196
225
6,398
2,355
2,635
28.0
28.0
10.8
12.5
18.1
15.7
3.9
3.4
21.7
21.7
2.7
2.4
Sun TV Network
Neutral
924
-
36,396
2,850
3,265
70.1
71.0
26.2
30.4
35.3
30.4
9.0
8.0
24.3
25.6
12.4
10.7
TV Today Network
Buy
269
344
1,607
567
645
26.7
27.0
15.4
18.1
17.5
14.9
2.6
2.3
14.9
15.2
2.4
2.0
Metals & Mining
Coal India
Neutral
275
-
170,486
84,638
94,297
21.4
22.3
24.5
27.1
11.2
10.1
4.7
4.4
42.6
46.0
1.5
1.4
Hind. Zinc
Neutral
267
-
112,753
14,252
18,465
55.9
48.3
15.8
21.5
16.9
12.4
2.8
2.4
17.0
20.7
7.9
6.1
Hindalco
Neutral
195
-
43,688
107,899
112,095
7.4
8.2
9.2
13.0
21.2
15.0
1.0
1.0
4.8
6.6
0.9
0.9
JSW Steel
Neutral
198
-
47,897
53,201
58,779
16.1
16.2
130.6
153.7
1.5
1.3
0.2
0.2
14.0
14.4
1.7
1.4
NMDC
Neutral
126
-
39,976
6,643
7,284
44.4
47.7
7.1
7.7
17.8
16.4
1.5
1.5
8.8
9.2
3.8
3.4
SAIL
Neutral
60
-
24,698
47,528
53,738
(0.7)
2.1
(1.9)
2.6
23.0
0.7
0.6
(1.6)
3.9
1.4
1.2
Tata Steel
Neutral
446
-
43,292
121,374
121,856
7.2
8.4
18.6
34.3
24.0
13.0
1.5
1.4
6.1
10.1
1.0
1.0
Vedanta
Neutral
234
-
69,329
71,744
81,944
19.2
21.7
13.4
20.1
17.5
11.6
1.5
1.3
8.4
11.3
1.4
1.1
Oil & Gas
Cairn India
#VALUE!
9,127
10,632
4.3
20.6
8.8
11.7
3.3
4.2
GAIL
Neutral
419
-
70,798
56,220
65,198
9.3
10.1
27.1
33.3
15.5
12.6
1.4
1.3
9.3
10.7
1.4
1.2
Indian Oil Corp
Neutral
443
-
215,165
373,359
428,656
5.9
5.5
54.0
59.3
8.2
7.5
1.3
1.1
16.0
15.6
0.7
0.6
Stock Watch
April 28, 2017
Company Name
Reco
CMP
Target
Mkt Cap
Sales ( Čcr )
OPM(%)
EPS (Č)
PER(x)
P/BV(x)
RoE(%)
EV/Sales(x)
(Č)
Price ( Č)
( Č cr )
FY17E FY18E
FY17E
FY18E
FY17E
FY18E
FY17E
FY18E
FY17E
FY18E
FY17E
FY18E
FY17E
FY18E
Oil & Gas
ONGC
Neutral
180
-
230,421
137,222
152,563
15.0
21.8
19.5
24.1
9.2
7.5
0.8
0.7
8.5
10.1
2.0
1.7
Reliance Industries
Neutral
1,408
-
457,804
301,963
358,039
12.1
12.6
87.7
101.7
16.1
13.9
1.6
1.5
10.7
11.3
2.0
1.7
Pharmaceuticals
Alembic Pharma
Accumulate
613
689
11,553
3,483
4,244
20.2
21.4
24.3
33.6
25.2
18.3
5.7
4.6
25.5
25.3
3.3
2.6
Alkem Laboratories Ltd
Buy
1,916
2,257
22,908
6,065
7,009
18.7
20.0
80.2
92.0
23.9
20.8
5.4
4.5
22.5
21.6
3.7
3.2
Aurobindo Pharma
Buy
609
877
35,689
15,720
18,078
23.7
23.7
41.4
47.3
14.7
12.9
3.8
3.0
29.6
26.1
2.5
2.2
Aventis*
Neutral
4,100
-
9,442
2,277
2,597
16.6
17.4
128.9
157.0
31.8
26.1
5.4
4.2
21.6
26.4
3.9
3.2
Cadila Healthcare
Neutral
445
-
45,567
10,429
12,318
17.7
21.6
13.1
19.2
34.0
23.2
7.1
5.6
22.8
27.1
4.4
3.6
Cipla
Sell
561
465
45,125
15,378
18,089
15.7
16.8
19.3
24.5
29.1
22.9
3.4
3.0
12.3
13.9
3.1
2.6
Dishman Pharma
Sell
316
143
5,093
1,718
1,890
22.7
22.8
9.5
11.3
33.2
27.9
3.2
2.9
10.1
10.9
3.4
3.0
Dr Reddy's
Neutral
2,593
-
42,965
16,043
18,119
18.0
23.0
78.6
130.9
33.0
19.8
3.2
2.8
10.1
15.2
2.4
2.4
GSK Pharma*
Neutral
2,558
-
21,667
2,800
3,290
10.2
20.6
32.2
60.3
79.4
42.4
14.7
14.5
17.2
34.5
7.5
6.4
Indoco Remedies
Accumulate
225
240
2,078
1,112
1,289
16.2
18.2
11.6
16.0
19.4
14.1
3.1
2.6
17.0
20.1
2.0
1.7
Ipca labs
Neutral
601
-
7,589
3,258
3,747
12.8
15.3
12.1
19.2
49.7
31.3
3.1
2.8
6.4
9.5
2.5
2.1
Lupin
Buy
1,337
1,809
60,387
15,912
18,644
26.4
26.7
58.1
69.3
23.0
19.3
4.5
3.7
21.4
20.9
3.9
3.2
Natco Pharma
Accumulate
927
974
16,161
2,090
2,335
32.1
26.6
26.8
23.2
34.6
40.0
9.8
8.5
28.4
21.1
7.8
95.7
Sun Pharma
Buy
637
847
152,819
31,129
35,258
32.0
32.9
30.2
35.3
21.1
18.0
3.4
2.8
20.0
20.1
4.5
3.8
Power
NTPC
Neutral
164
-
135,514
86,605
95,545
17.5
20.8
11.8
13.4
13.9
12.3
1.4
1.3
10.5
11.1
2.9
2.9
Power Grid
Accumulate
207
223
108,425
25,315
29,193
88.2
88.7
14.2
17.2
14.6
12.1
2.2
1.9
15.2
16.1
8.9
8.0
Tata Power
Neutral
85
-
22,896
36,916
39,557
17.4
27.1
5.1
6.3
16.6
13.4
1.5
1.3
9.0
10.3
1.6
1.5
Real Estate
MLIFE
Buy
437
522
1,793
1,152
1,300
22.7
24.6
29.9
35.8
14.6
12.2
1.1
1.0
7.6
8.6
2.3
1.9
Prestige Estate
Neutral
246
-
9,234
4,707
5,105
25.2
26.0
10.3
13.0
23.9
18.9
1.9
1.8
10.3
10.2
3.1
2.8
Telecom
Bharti Airtel
Neutral
358
-
143,087
105,086
114,808
34.5
34.7
12.2
16.4
29.3
21.8
2.0
1.9
6.8
8.4
2.3
2.0
Idea Cellular
Neutral
85
-
30,771
40,133
43,731
37.2
37.1
6.4
6.5
13.3
13.1
1.1
1.0
8.2
7.6
1.8
1.5
zOthers
Abbott India
Neutral
4,378
-
9,303
3,153
3,583
14.1
14.4
152.2
182.7
28.8
24.0
141.2
120.6
25.6
26.1
2.7
2.3
Asian Granito
Accumulate
378
405
1,137
1,060
1,169
12.2
12.5
12.7
15.9
29.9
23.8
2.8
2.5
9.5
10.7
1.4
1.2
Bajaj Electricals
Accumulate
347
395
3,514
4,801
5,351
5.7
6.2
10.4
13.7
33.3
25.4
4.1
3.7
12.4
14.5
0.7
0.7
Banco Products (India)
Neutral
231
-
1,650
1,353
1,471
12.3
12.4
14.5
16.3
15.9
14.2
22.0
19.8
14.5
14.6
1.2
124.7
Coffee Day Enterprises
Neutral
248
-
5,116
2,964
3,260
20.5
21.2
4.7
8.0
-
31.0
2.9
2.6
5.5
8.5
2.1
1.9
Ltd
Competent Automobiles Neutral
233
-
149
1,137
1,256
3.1
2.7
28.0
23.6
8.3
9.9
44.7
40.4
14.3
11.5
0.1
0.1
Stock Watch
April 28, 2017
Company Name
Reco
CMP
Target
Mkt Cap
Sales ( Čcr )
OPM(%)
EPS (Č)
PER(x)
P/BV(x)
RoE(%)
EV/Sales(x)
(Č)
Price ( Č)
( Č cr )
FY17E
FY18E
FY17E
FY18E
FY17E
FY18E
FY17E
FY18E
FY17E
FY18E
FY17E
FY18E
FY17E
FY18E
zOthers
Elecon Engineering
Neutral
61
-
683
1,482
1,660
13.7
14.5
3.9
5.8
15.6
10.5
3.7
3.4
7.8
10.9
0.8
0.7
Finolex Cables
Neutral
525
-
8,025
2,883
3,115
12.0
12.1
14.2
18.6
37.0
28.2
19.7
17.2
15.8
14.6
2.5
2.2
Garware Wall Ropes
Neutral
755
-
1,652
863
928
15.1
15.2
36.4
39.4
20.7
19.2
3.8
3.2
17.5
15.9
1.8
1.7
Goodyear India*
Neutral
900
-
2,075
1,598
1,704
10.4
10.2
49.4
52.6
18.2
17.1
84.1
73.7
18.2
17.0
1.0
140.5
Hitachi
Neutral
1,761
-
4,788
2,081
2,433
8.8
8.9
33.4
39.9
52.7
44.1
42.5
35.5
22.1
21.4
2.3
1.9
HSIL
Neutral
341
-
2,463
2,384
2,515
15.8
16.3
15.3
19.4
22.3
17.6
22.1
19.0
7.8
9.3
1.2
1.1
Interglobe Aviation
Neutral
1,120
-
40,468
21,122
26,005
14.5
27.6
110.7
132.1
10.1
8.5
60.5
43.2
168.5
201.1
1.9
1.5
Jyothy Laboratories
Neutral
412
-
7,492
1,440
2,052
11.5
13.0
8.5
10.0
48.5
41.2
11.8
10.9
18.6
19.3
5.5
3.8
Kirloskar Engines India
Neutral
398
-
5,751
2,554
2,800
9.9
10.0
10.5
12.1
37.9
32.9
15.8
15.0
10.7
11.7
1.9
1.7
Ltd
Linc Pen & Plastics
Neutral
304
-
449
382
420
9.3
9.5
13.5
15.7
22.6
19.4
3.9
3.3
17.1
17.3
1.2
1.1
M M Forgings
Neutral
596
-
720
546
608
20.4
20.7
41.3
48.7
14.5
12.2
81.7
72.3
16.6
17.0
1.2
1.0
Manpasand Bever.
Neutral
706
-
4,037
836
1,087
19.6
19.4
16.9
23.8
41.8
29.6
5.0
4.4
12.0
14.8
4.6
3.4
Mirza International
Neutral
108
-
1,295
963
1,069
17.2
18.0
6.1
7.5
17.6
14.3
2.7
2.3
15.0
15.7
1.6
1.4
MT Educare
Neutral
80
-
318
366
417
17.7
18.2
9.4
10.8
8.5
7.4
1.9
1.7
22.2
22.3
0.8
0.7
Narayana Hrudaya
Neutral
322
-
6,587
1,873
2,166
11.5
11.7
2.6
4.0
121.9
81.3
7.5
6.8
6.1
8.3
3.6
3.1
Navkar Corporation
Buy
212
265
3,030
369
561
42.9
42.3
6.9
11.5
30.8
18.4
2.2
1.9
7.4
10.5
9.2
6.1
Navneet Education
Neutral
171
-
3,992
1,062
1,147
24.0
24.0
6.1
6.6
28.1
25.8
5.8
5.1
20.6
19.8
3.8
3.6
Nilkamal
Neutral
2,191
-
3,270
1,995
2,165
10.7
10.4
69.8
80.6
31.4
27.2
125.2
108.8
16.6
16.5
1.6
1.5
Page Industries
Neutral
14,272
-
15,919
2,450
3,124
20.1
17.6
299.0
310.0
47.7
46.0
317.9
242.7
47.1
87.5
6.5
5.2
Parag Milk Foods
Neutral
250
-
2,102
1,919
2,231
9.3
9.6
9.5
12.9
26.5
19.3
4.1
3.4
15.5
17.5
1.2
1.1
Quick Heal
Neutral
246
-
1,727
408
495
27.3
27.0
7.7
8.8
31.8
28.0
3.0
3.0
9.3
10.6
3.4
2.8
Radico Khaitan
Buy
122
147
1,619
1,667
1,824
13.0
13.2
6.7
8.2
18.3
14.9
1.7
1.5
9.0
10.2
1.4
1.2
Relaxo Footwears
Neutral
485
-
5,822
2,085
2,469
9.2
8.2
7.6
8.0
64.1
61.0
24.9
21.2
17.9
18.8
2.9
2.5
S H Kelkar & Co.
Neutral
319
-
4,613
1,036
1,160
15.1
15.0
6.1
7.2
52.2
44.4
5.6
5.1
10.7
11.5
4.3
3.8
Siyaram Silk Mills
Accumulate
1,701
1,872
1,595
1,652
1,857
11.6
11.7
92.4
110.1
18.4
15.4
2.7
2.4
14.7
15.2
1.2
1.0
Styrolution ABS India*
Neutral
748
-
1,315
1,440
1,537
9.2
9.0
40.6
42.6
18.4
17.6
47.0
42.8
12.3
11.6
0.9
0.8
Surya Roshni
Neutral
256
-
1,121
3,342
3,625
7.8
7.5
17.3
19.8
14.8
13.0
28.1
22.6
10.5
10.8
0.6
0.5
Team Lease Serv.
Neutral
1,071
-
1,831
3,229
4,001
1.5
1.8
22.8
32.8
47.0
32.6
5.0
4.4
10.7
13.4
0.5
0.4
The Byke Hospitality
Neutral
212
-
850
287
384
20.5
20.5
7.6
10.7
27.9
19.8
5.8
4.7
20.7
23.5
3.0
2.2
Stock Watch
April 28, 2017
Company Name
Reco
CMP
Target Mkt Cap
Sales ( Čcr )
OPM(%)
EPS (Č)
PER(x)
P/BV(x)
RoE(%)
EV/Sales(x)
(Č)
Price ( Č)
( Č cr )
FY17E FY18E FY17E FY18E FY17E FY18E FY17E FY18E FY17E FY18E FY17E FY18E FY17E FY18E
zOthers
Transport Corporation of
Neutral
233
-
1,785
2,671
2,911
8.5
8.8
13.9
15.7
16.8
14.9
2.3
2.1
13.7
13.8
0.8
0.7
India
TVS Srichakra
Neutral
4,101
-
3,141
2,304
2,614
13.7
13.8
231.1
266.6
17.7
15.4
460.8
362.9
33.9
29.3
1.4
1.2
UFO Moviez
Neutral
469
-
1,295
619
685
33.2
33.4
30.0
34.9
15.7
13.4
2.2
1.9
13.8
13.9
1.8
1.4
Visaka Industries
Neutral
331
-
525
1,051
1,138
10.3
10.4
21.0
23.1
15.8
14.3
42.4
39.7
9.0
9.2
0.8
0.7
VRL Logistics
Neutral
331
-
3,022
1,902
2,119
16.7
16.6
14.6
16.8
22.7
19.7
5.0
4.4
21.9
22.2
1.7
1.5
Wonderla Holidays
Neutral
388
-
2,194
287
355
38.0
40.0
11.3
14.2
34.4
27.3
4.9
4.3
21.4
23.9
7.3
5.9
VIP Industries
Accumulate
198
218
2,795
1,270
1,450
10.4
10.4
5.6
6.5
35.3
30.4
7.3
6.4
20.7
21.1
2.2
1.9
Navin Fluorine
Buy
3,149
3,650
3,083
789
945
21.1
22.4
120.1
143.4
26.2
22.0
4.2
3.6
17.8
18.5
3.8
3.1
Source: Company, Angel Research; Note: *December year end; #September year end; &October year end; Price as on April 27, 2017
Market Outlook
April 28, 2017
Research Team Tel: 022 - 39357800
DISCLAIMER
Angel Broking Private Limited (hereinafter referred to as “Angel”) is a registered Member of National Stock Exchange of India
Limited,Bombay Stock Exchange Limited and Metropolitan Stock Exchange Limited. It is also registered as a Depository Participant with
CDSL and Portfolio Manager with SEBI. It also has registration with AMFI as a Mutual Fund Distributor. Angel Broking Private Limited is a
registered entity with SEBI for Research Analyst in terms of SEBI (Research Analyst) Regulations, 2014 vide registration number
INH000000164. Angel or its associates has not been debarred/ suspended by SEBI or any other regulatory authority for accessing
/dealing in securities Market. Angel or its associates/analyst has not received any compensation / managed or
co-managed public offering of securities of the company covered by Analyst during the past twelve months.
This document is solely for the personal information of the recipient, and must not be singularly used as the basis of any investment
decision. Nothing in this document should be construed as investment or financial advice. Each recipient of this document should make
such investigations as they deem necessary to arrive at an independent evaluation of an investment in the securities of the companies
referred to in this document (including the merits and risks involved), and should consult their own advisors to determine the merits and
risks of such an investment.
Reports based on technical and derivative analysis center on studying charts of a stock's price movement, outstanding positions and
trading volume, as opposed to focusing on a company's fundamentals and, as such, may not match with a report on a company's
fundamentals. Investors are advised to refer the Fundamental and Technical Research Reports available on our website to evaluate the
contrary view, if any.
The information in this document has been printed on the basis of publicly available information, internal data and other reliable
sources believed to be true, but we do not represent that it is accurate or complete and it should not be relied on as such, as this
document is for general guidance only. Angel Broking Pvt. Limited or any of its affiliates/ group companies shall not be in any way
responsible for any loss or damage that may arise to any person from any inadvertent error in the information contained in this report.
Angel Broking Pvt. Limited has not independently verified all the information contained within this document. Accordingly, we cannot
testify, nor make any representation or warranty, express or implied, to the accuracy, contents or data contained within this document.
While Angel Broking Pvt. Limited endeavors to update on a reasonable basis the information discussed in this material, there may be
regulatory, compliance, or other reasons that prevent us from doing so.
This document is being supplied to you solely for your information, and its contents, information or data may not be reproduced,
redistributed or passed on, directly or indirectly.
Neither Angel Broking Pvt. Limited, nor its directors, employees or affiliates shall be liable for any loss or damage that may arise from
or in connection with the use of this information.